Growth Curves
To aid in development of feeding programs, producers should understand the changes in growth rate of pigs during the grow-finish period. When body weight is plotted versus age, the typical growth curve follows a linear shape (Figure 1). After plotting BW versus age, producers can calculate ADG at different timepoints and depict ADG versus weight (Figure 2). It can be observed that pigs undergo rapid periods of growth in the early stages, reach a maximum, and decline at heavier bodyweights. Growth curves should be developed as average daily gain versus body weight to develop nutrient requirements. As the growth rate slows, less nutrients are required to support maintenance and growth. This allows for more accurate diet formulation by preventing excess nutrients being supplied from the diet. Furthermore, producers should understand that the point at which grow-finish pigs reach their maximum growth rate can vary based on genetic line used. Different genotypes will exhibit different rates of protein accretion and this will change the point at which protein deposition is maximized.
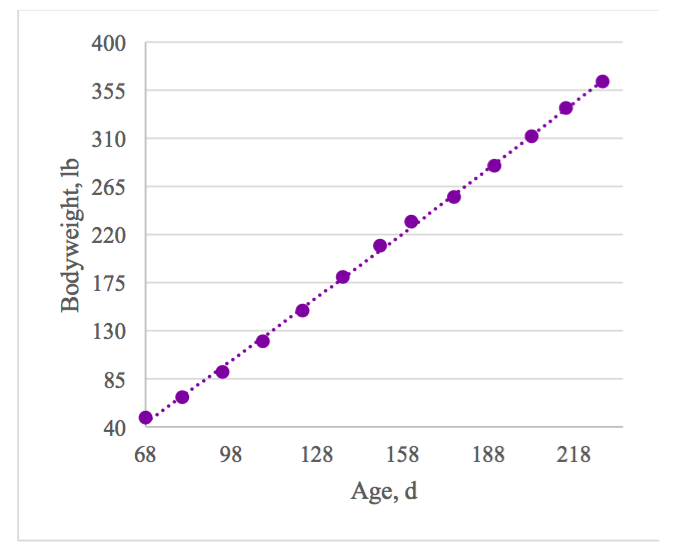
Figure 1. Diagram of a typical growth curve of body weight vs age for growing-finishing pigs from birth until market (Adapted from Lerner, 2019).
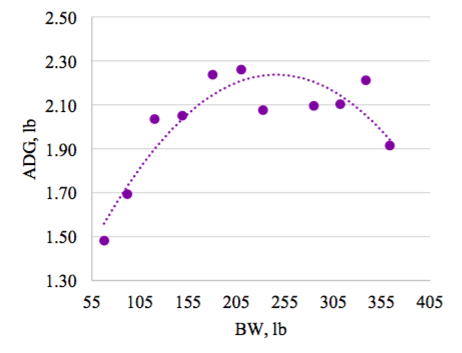
Figure 2. Diagram of a typical growth curve of ADG vs body weight for growing-finishing pigs from weaning until market (Adapted from Lerner, 2019).
Fact Sheet: Establishing Phase Feeding Programs and Feed Budgets